Here is the transcription and Graphs
So I’m gonna first of all go into the Perth Sale Market and the Rental Market. I’ll give you a quick update on both of those, where we’re at and compare it to where some of the other capital cities around Australia are at.
Perth Sale Market
So Perth Sale Market, I love watching the trend of things and the most important thing is never to look at a small period of time and the trend is the most important thing to observe.
And you also need to look back at how it compares with the past. What you see in the media, I really turn off to, because it’s like, you know the market it’s up this month or it’s down this month. A month doesn’t really matter, to be honest. And they just use whatever they can in that month to write a headline in the story, it’s crap.
Number For Sale
So what I’m focused on is overall trend and this is number of properties for sale, right. And you can see that back in 2013, when I started tracking this every month, we were at 9,000 properties for sale. We’re now at 14,650, so we’re in a buyer’s market now, we were in a seller’s market then.

So, what’s most notable when I look at where we’re at in the market now is that we’ve actually for the first time, four months ago, started having lowest supply than we had the same time the previous year.
And why is that important because that shows that we’re going backwards with supply, we’re heading back on a downward trend compared to where we were. So, we’ve definitely been through the worst and it’s now being confirmed each of the month for the last four months.
You can see that we’ve got 14,600 on the market now and at the same time last year, if I look correctly, we had 15,600 so, we’ve got less. And at what we see, the season’s, there’s more properties that come on in spring, there’s more properties that come on in January and this is ebbing and flowing.
So most, important thing to note is that we’re down on last year and I’ll be watching very closely to see that this trend continues but we’re heading back the other way and have been through the worst as far as I can see.
Number Sold
What also confirms that is that we’ve actually got more properties being sold per week than the same time last year, slightly more, it’s not massively more but it’s certainly still more and it’s a number to be positive about.
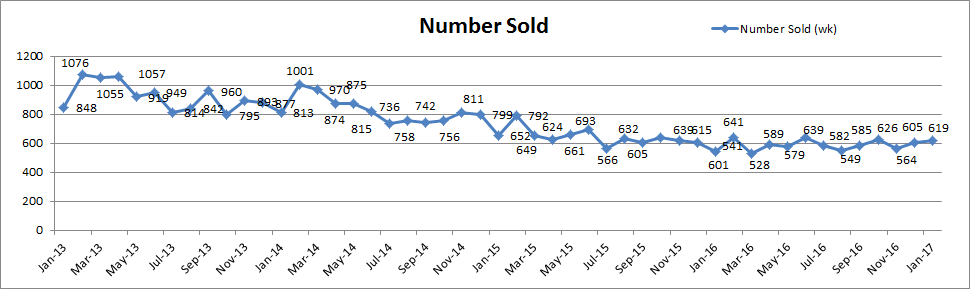
You can see how the overall trend has been completely down. The supply is always the leading indicator and we need that demand to spike back up, and then we’ll see the supply coming down by even more each month.
So things like the first home buyers grant which has just been increased to $15,000. Things like our commodity prices that have been increasing month on month giving more confidence to the market, more confidence to mining, making projects more viable. These are things that affect the demand side of the equation.
So I started to get excited two months in, I’m more excited at four months but the only way we know when we’re fully corrected is that we start seeing a flow through to demand.
Capital Growth
That leads me to the next part of that equation that makes me more excited is that we had growth at a lot of our top end suburbs for last year.
And it was the upgraders that were going into the $700,000 to $1.2 million dollar range suburbs that took advantage of them being down and they’ve upgraded into them.
So what happens in any market when it starts to recover is that the growth always and from what I’ve seen around Australia, this is the case, it always starts at the highest and most premium price points and then it ripples down.
As that suburb becomes too overpriced, people look for value in the neighboring suburbs. And then it ripples out. And all my looking into the stats shows that the bottom end, in the Midland, in the Armadale, in Kwinana, they’re struggling the most and have hurt the most in this period.
So they’ve got the longest to go before they recover. And they have the hurt with the economy too because unfortunately that’s where it’s suffering the most.
So this year, the biggest winners in 2016 for units you can see it was a lot of kind of blue chip unit suburbs like the Attadale, the Shenton Park, the Applecross, the Vic Parks, they held up pretty well and seen varying degrees of growth over the last year.
So if you just watched the news, you’d think that no where’s growing, that no where’s increased in prices but this is quietly happening under everyone’s noses.
So what I expect to happen this year is the mid price points will start to get more interest. And I think a lot of those areas are going to appear in another year’s time on the top growth suburbs lists and that’s what I’ve already started to see happening on the ground.
Perth Rental Market
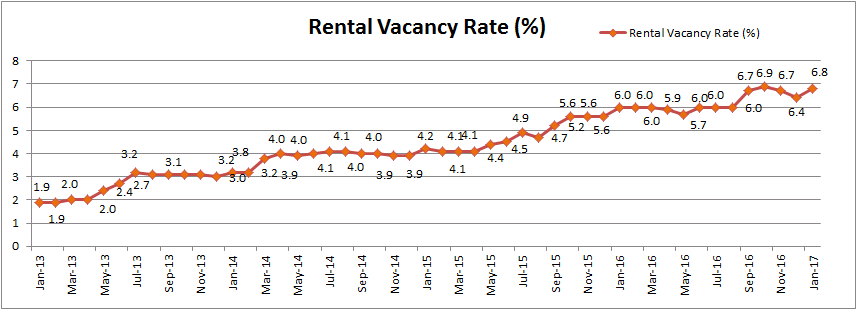
Rental Supply
So Perth Rental Market, just quickly diving into this. It’s a similar case that we’ve actually started to see a decrease. We’ve got a decrease down in the overall supply compared to where we were at in July.

So, I’m very happy about that, we’ve always got a little upturn in January because everyone’s comes in the market because it’s our peak period but given that, we’re now a fair bit down on where we were at in July.
I’m much more positive about the rental market turning too and the supply always leads the vacancy in prices. So our number for rent has to come down, then we have more competition and the vacancy will drop and rental prices will start to stabilize.
So I’m keeping close eye on that as well obviously and different areas are affected worse than others. As I said, for prices, it’s similar for rentals, the bottom end of the market has struggled the most.
Timing the Property Clock
So timing the property clock, I keep a very close eye on this. Herron Todd White has got us approaching the bottom of the market by indicating that our South West is at the bottom of its market.
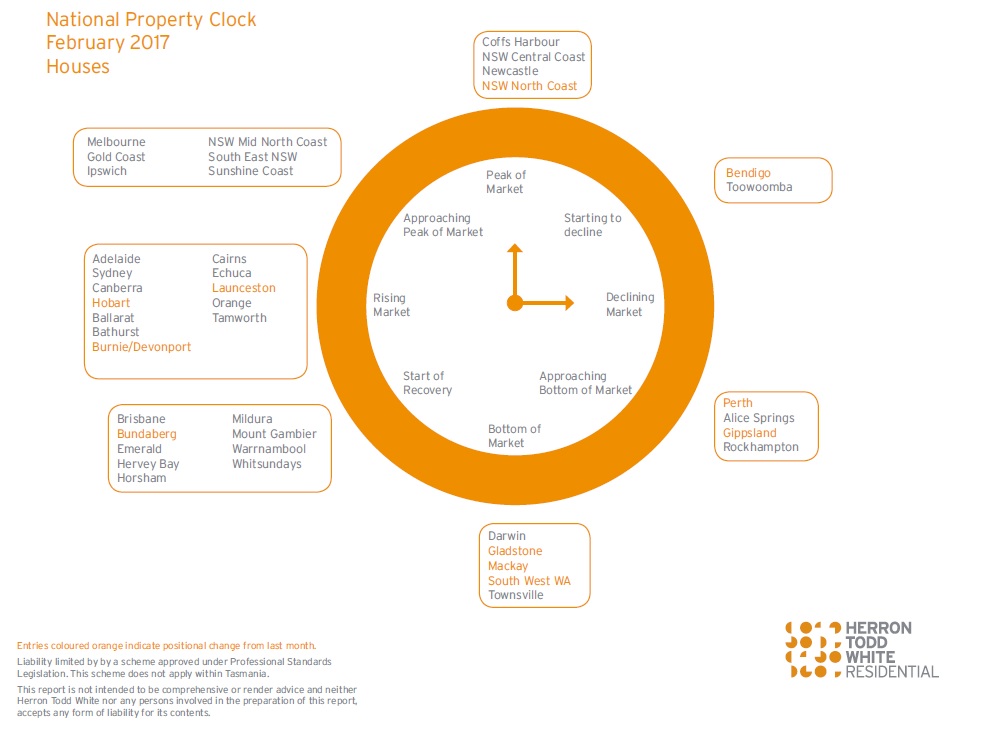
Interestingly, the down south west areas have actually seen quite modest growth for last year as well.
My parents happen to retire to Mandurah, some of their suburbs around there have done exceptionally well, so they kind of did well on selling in Perth and buying in Mandurah and timed it quite well.
So a lot of people have been taking up bargains in those areas, a lot of people have started to retire which is putting more pressure on those areas. And I think that’s where the increase in demand in those kind of places is coming from. But for me it doesn’t make for a good long term investment, it’s much more risky being in the South West than it is in Perth Metro.
So units are definitely by my account trailing, they’re still in a well declining market and that’s why with all of my predictions and all of the things that I’m looking at, I’m focused very much on houses now to invest in ahead of units that are higher density.
Especially with the changes we had to the R-Codes which is having more high density units flow into these suburbs and its going to keep happening for some time until it kind of really stabilizes. So houses where you’ve got a land component where you’ve got it to non-attached villa or some land components are definitely better to look at and units will turn after the houses do.
Comparing with Sydney
So the crazy thing is, we get trapped in our bubble and that’s why it helps first to look at Sydney and we often we grow counter cyclic to Sydney.

And you can see during 2010 to 2014, Sydney was basically sitting flat. And when we had our last boom across here, 2002 to 2007, Sydney again sitting flat. Everyone over there was like “Why are we missing out? What’s happening over in Perth?”
A lot of the smart investors are already over here investing in Perth now. And now the opposite happens, Sydney had this crazy growth the last four years.
Look they have gone from $540,000 in 2008 to over a million now, it’s insane, you know. The money that people had made on the east coast has been massive and then they’ve started investing and flowing up to Brisbane and their market’s been more hotter than the last year.
And we’ve already started to get an increase in enquiries from Eastern States investors only over the last six weeks. That’s another very good sign that we’re relatively looking like much better value.
They’ve made money in Sydney and made some money in Brisbane now continue to do well in Brisbane over the next twelve to eighteen months and then it will flow like a, avalanche around to us and it will be fun when it starts to continues to increase.
Questions
Post your questions on the Perth sale and rental market below and I will be sure to take the time to respond.