Here I bring you my latest update on the Perth Property Market taking a deep look at the sale market, current property clock, average selling times, Perth rental market, investor psychology and how to survive and thrive in this Buyers Market… You have the option to watch the video version or see the transcription with graphs below, enjoy 🙂
See the Transcription with Graphs here…
G’day! Jarrad Mahon here from Investors Edge Real Estate and thanks for joining me for my Perth Property Market Update for November.
It’s been five months since I brought you my last update, yes it’s been a while, I’m sorry, I’ve been busy, but I’m going to really give you your money’s worth on this one. I’m going to make comparisons of where the market’s been going to over the last five months as well as over the last year so you could really see the trend of what’s going on.
Where is the bottom?
The big question I’m asking myself is, where is the bottom? Well, the simple answer to that is we do not know where the bottom is until it starts to come back up. And if you are an investor, you don’t want to be left on the side line seeing it pass you by, so look at taking action, taking opportunities in this market. So we are going to go through a bit of psychology involved in that later.
Perth Sale Market
First of all, the Sale Market… where things have really got to over the last five months since June is, we had 14,300 properties on the market in June. We’re now at 16,300 so that’s a whopping 14% increase, and since the same time last year, we’ve had a 28% increase.

So, just having that number of properties on the market gives by us more choice and we are see properties having to reduce price in order to be sold and taking longer to sell. So what is happening out there is there’s a lot of sellers that aren’t in reality on where their market price is. They’re saying to their agent “let’s just try that price out” but once the property goes stale after 4-6 weeks, the chances of getting a sale really drop off, so you really need to price it right from the start.
So, with that kind of percentage increase things have risen very steeply since June. For the 6 to 8 months before that, they were quite steady. So, I was telling you to prepare for the worst back in June and that’s definitely happened since.
So let me look at the number of properties sold, since that time, we can also see a decrease in the weekly sales by about 11%. So we’re now down below 600’s sales per week. The reason that’s notable and strange is we’re in spring now which is ordinarily a high turnover period for the year but we’re just not getting the buyer’s closing those sales. So that’s another worrying sign that once we get to the other end of spring, there’s going to be even more properties for sale. We’re seeing them come on, but not sell.

So, since the same time last year, we’re seeing a 24.7% decrease on what’s being sold each week.
Days on Market
Now, days on market, I’ve just added this in as an extra thing to report to you on. You can see that the average selling days across the Perth metro area is 71 days, that’s a hell of a lot of time. And an average always means that properties are taking longer to sell, and properties still selling more quickly than this.
The average vendor discount is 58%, so that means 58% of those properties sold are having to discount before they sell and on average they’re having to discount around 6%. So the closer we can get to pricing a property right, the quicker the selling time, the more competition and the better price that you get.
This information here is showing the longest selling suburbs in Perth for units and the quickest selling suburbs in Perth for units. And you’ve noticed that the popular areas are all in the lower, more affordable suburbs and the longer selling areas are down in places like Rockingham. We’ve got a real over supply in South Perth and some of the upper end areas have a much higher median house price are taking much longer to sell than around the middle median price. So the higher end suburbs are taking longer.

Price Indicators over the last year
So how does all this affect prices? That’s what you at home are probably asking yourself. Well, the actual price index report for October shows a very modest to negligible change in the actual prices of properties.
But that’s looking at the median price not your actual property’s price. So the only way to know how your property’s been affected is to request an appraisal, now we can do one of those for you. It only takes half an hour over the desktop to give you a reasonable guide. If you want more accurate, we can come out and appraise your property. So do feel free to request one of those. My team can help you anywhere in Perth.
Just generally looking at the median price, we can see that the top end has been struggling the most. And prices have fall back in the top quarter of suburbs by 1.3%, so price drops are still not really showing up in the data yet.
The most affordable end of the strata which likely to be the suburbs that are selling quickest, we have actually seen a modest 0.5% increase over the last 12 months too. And Tim Lawless of RP Data is predicting the top end of the market to be the most affected over the next 12 months.
So, I think the real impact of this property oversupply with fewer buyers in the market is still to show up in our price data.
National Property Clock
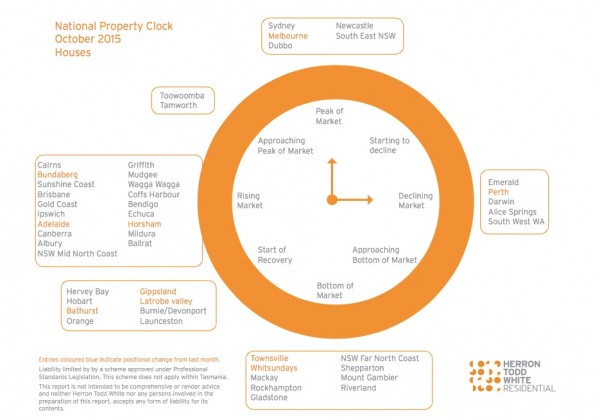
The Property Clock, this is from Herron Todd White. I really do love tracking their take on things for us. We can see Melbourne’s now moved up to its peak of their market along with Sydney. We can see that Adelaide’s starting to be on the rising market stage and you can see that Perth has remained in a declining market. Now, yes, capital cities do move about their property cycles but what people don’t appreciate is that a city doesn’t stay in a stage for an equal amount of time. We can get down to approaching the bottom and be at the bottom in a very quick time compared with a declining market and we can spend a long time in a rising stage as we had done in recent years.
So, yes, the indicators are still showing that we’re declining. So expect things to pull back a bit and to show up in the price data over the coming 6 to 12 months. And then I think we’d likely stabilize for approximately the next 12 months after that and would probably be about 3 years before we see things coming back up again. That’s just my take on things. I wouldn’t suggest that you sit on the side lines and wait that whole time. The only way to know when it’s growing is to see it pass you by and wish at that point that you bought more.
Perth Rental Market
So now going into the rental market. The Number of properties for rent, you can see, have also climbed quite substantially since June. Has been about a 10% increase, notice the rental market’s holding steady within the sale market.
But the big notable thing for the rental market is, that actually shocked me is, compared to last November, we’ve had a 43% increase in the number of properties for rent, now that’s massive. And where we actually saw the majority of the increase was from January to July this year. We’ve actually stabilize a fair bit in the last 5 months and just the 10% increase over that time. So I’m hoping that we will stabilize in the rental market.

But what will happen in the shorter term is once we hit December, the number on the market will come down, that’s a seasonal thing, there’ll be very few tenants out and about and then everyone will re-launch their properties in January. We set our leases to not expire on December for that very reason. But January and February are very busy months, usually from the 2nd week of January onwards so I’m hoping that’s going to stabilize the market.
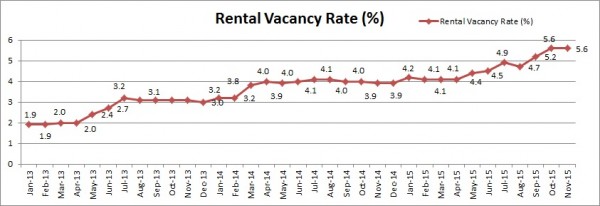
Rental Vacancy Rate
The Rental Vacancy Rate has really shut up in the last 5 months. You can see a 24% increase. The Vacancy Rate, the data was just catching up with where it actually was in the market. You can see a 43% increase in the level of vacancy compared with last year and that is in line with the 43% increase in the number of properties for rent. So I think the vacancy rate is now at 5.6% and that’s reflective of what’s actually out there in the market and I’m hoping it doesn’t have further to rise.
Median Rent
The median rent, you can see is now down at $410 per week. We’ve had a modest 4.6% decrease since June and we’re really not talking huge drop compared to some of the other areas around Australia. We’ve only pulled back 8.9% since November 2014.

So generally, if your property was worth 400, it’s now worth about 360 and that’s what we’re seeing in most areas as the leases come up for renewal. And we’re taking approximately 2 weeks to rent the property at the moment. We’re trying to get a 4 week head start just to give us a bit more time to find new tenant.
Again, once we find the right price, the property will rent to a quality tenant quickly enough. So don’t delay in finding the price. The key is to keep revising until you get enough inquiry to be able to select a good tenant from the group.
Seeing 2 sides of the coin
 A bit the psychology here and I just love this analogy when I heard it. Picture your perspective being like 2 sides of the coin. What most average investors do, is they only see the market’s one perspective and that’s usually fear. They’re so afraid to act in this market that they run for cover. And by doing that, they’re not seeing all the other opportunities, all the great buys, all the chances to get ahead in this market and position yourself for when it turns around and that’s the other perspective, the other side of the coin.
Now, as we get more and more sophisticated with our investing, we start to see both sides of the coin. So challenge yourself when you’re feeling that fear to step above it and at least start looking and preparing yourself for opportunities. And that’s what I would strongly suggest, if you want to elevate yourself as an investor because every time we’ve gone through a down period, I’ve always looked back and said I wish I bought more. This time I’m preparing and taking action in this market as much as possible.
Tips to Survive & Thrive
 So finally, these are the same tips that I finished with 5 months ago on how to survive and thrive in this market. I wanted to cover them again just in case you didn’t see them.
- Set yourself a cash buffer of $5k especially if you’ve already got investment properties, so that you can just handle any maintenance that comes up in an unexpected vacancy period.
- Free up equity. It’s always best to ask the banks for what when you can and have it there for when you need it.
- Be open to opportunities. Do start to look at what great buys you can get in this wonderful buyer’s market.
- And if you are going to sell a property, sell it now or wait 1-2 years because things are likely to decline a bit more before they get better.
- And finally, always look to re-assess your plan. See how your current property fits into that plan and see about how many properties you’re going to need to set yourself up with to retire.
So, that’s my final point and my final slide on this preso, my latest Perth Property Market Update.
Thanks for joining me and do let me know any questions you’ve got, love to get your feedback. Bye for now!