See the Transcription & Graphs here
G’day! Jarrad Mahon here from Investors Edge, bringing you my final Perth Property Market Update for 2019 where I’m actually going to go deep into the sale market, rental market, my crystal ball for what to expect moving forward with some of the Suburbs I’m focusing on and the time frames. At last market update in August, I went into some of the demand drivers. I’m going to be touching on them again and giving you some deeper insights into some areas that I haven’t touched on before, which I’m really excited to share with you. So hang on, I will launch into it firstly with the Sale Market.

Number For Sale
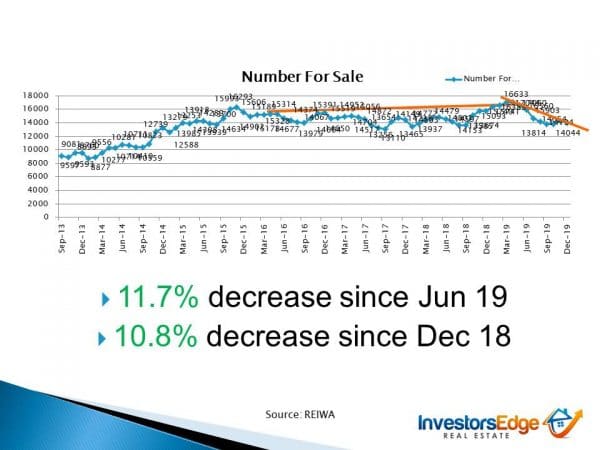
You can see that the number of properties for sale was actually trending sideways slight down up until September last year and then we had a number of properties coming on and building up in for Sale as we went into the election and that was very much a result of less buyers out there that caused the properties that were on the market to be sticking. Since then sellers have become a lot more realistic about the prices that are achievable. We’ve now got the sales data our there, has been activity to show prices. So for those that can’t get enough of their deposit or equity out to buy again, they’re unfortunately having to stay trapped in their house and are not a buyer that would otherwise be in the market.
And any investor that was hoping to re-group some money from their sale is having to stay put and keep their Investment Property. So sellers are a lot more realistic on those fronts because we can see what the prices are. So it is overall good that our markets trending and becoming tighter and we’re now at 14,000 properties for Sale, roughly a 11% decrease on six months ago and 10.8% down on the same time last year. So you can see that we’re now getting to a lower point than where we’ve been at in probably four years or so and that we are headed to the conditions where we can see that the demand exceeds the supply.
Number Sold

So what’s going to happen on the demand side? That’s what we are really waiting for a change, until this kicks up, until we see the demand increase from ever increasing population. We’re not going to see the prices start to increase until that happens. You can see that the trend from way back as far as I’ve been measuring since 2013, it has been downwards overall for six years now.
We have had a bit of a tick up above that longer term average in October, November and December this year. We are seeing our average weekly number of sales being larger for the first time in awhile is that just a blip or are we entering into a new trend? We will need to see come January and February. The reason I’m not calling a recovery and a bounce back on our demand side yet is that we did have some pretty bad months leading up to the election and in post election that we were at some of our lowest number of properties selling for each month. I feel that this demand we’ve seen wash throughout has been pent up from around that election period. So I’m not calling a recovery yet unfortunately.
Perth House Sales and Median Price

When we look at the median house price, you can see that showed up more and more drops. We’re at $482,750 at the moment and it’s been a continual dropping down for the last five years and if he blips where we thought we might have been coming back up hasn’t gone out of that trend line, units is worse and steeper.
We’re now at $377,500 and there’s going to be a lot of pain in my opinion on the unit side before we get around because the unit market typically trails the housing market by 12 to 18 months. Some of the recent policy changes I mention later could affect this timeframe.
Average Selling Days

The average selling time tells us the true picture of the supply versus demand, even though the supplies tight with less properties to choose from, properties are still taking longer on average to sell.
We are at 84 days now which is the longest that we’ve had across that 4-5 years of measuring and it’s a pretty worrying step that there’s really not that many buyers out there. Properties are still taking a long time to sell. You know until we start seeing that this is coming back the other way, I’m not calling it a recovery either.
Under Construction
This is a new stat that I thought to insert and thank you to some of our viewers that give me feedback. I really appreciate feedback good, bad or constructive.
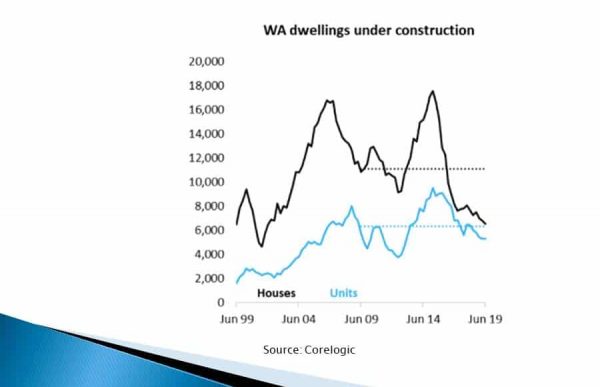
I thought of putting here some stats on new dwellings under construction so we can see what supply is coming to the market from that side of things. It also gives us a guide as to how the building industry is faring compared to previously and obviously employs a lot of people and a bit of a sign of how our economy’s going and you can see that we’ve reached the peak of dwellings under construction approximately mid 2014.
That’s when we know our last peak of the market to date and the stats run to June 19 at this point. You can see that we’re at an all-time low that that we last had back in 2001 for houses and roughly 2012 for units is when we were last at this low of dwellings under construction.
That’s approximately 6,000 dwellings under construction of houses and 5,500 construction for units. So that has certainly come a long way down and when you consider we’re up at 18,000 under construction in June 2014 to now be at jist 6,000. That’s shrinking by a huge amount or about a third of what we were building previously. So again, until we start seeing that come back up, we’re not going to be in recovery but it does go to show that not too much supply is coming from the new dwellings.

Numbers For Rent

We’ve seen the number for rent actually continued to decrease slightly over the last three to four months, so it’s still heading the right way. You can see that trends will be definitely in place since December of 2017 when markets started tightening up for rent then we’re about 13% down on number for rent compared to last year and approximately 20% down from six months ago.
Rental Vacancy Rate (%)

The vacancy rate you can see had a sharp decrease from it’s peak at 7.6% to arrive at 2.5% in approximately January and February this year. We’ve been picked back up to 2.9% where we’ve stayed for around the last six months, not much of a change on a year ago and we’ve had a slight increase from the 2.5% to 2.9% over the last six months. So 3% is generally understood as the point where supply equals demand and prices stay the same.
Median Rental Price
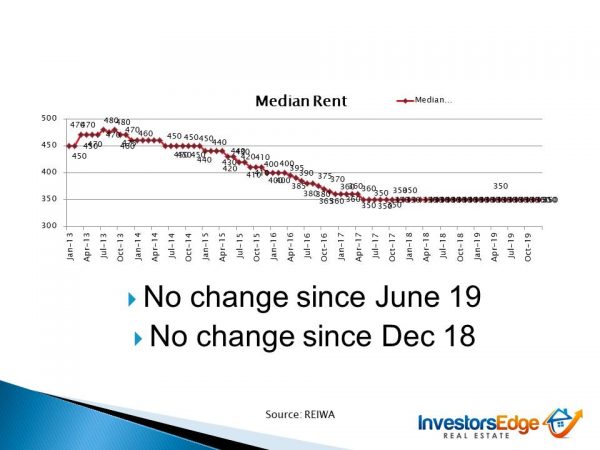
So that’s been reflected in our median rent, staying at 350 per week. Now, I expect that as projects starts to kick on and as population starts to kick up a bit, all the new entrants to the state, the majority of them will be renting first and that should be where we see the prices increase on the rental side before we see it on the housing buying side. So think about it when you come to an area and you start out to save your deposit then after you’ve rented for awhile, you look at buying so that’s what I expect to happen.
Property Clock Timing

So the property clock timing confirms my thoughts with us still being seen at the bottom of the market both here unchanged. We’ve got some changes lately for Adelaide growing from it’s bottom of the market and our Southwest moving down to approaching the bottom of the market. And we’ve got areas such as Brisbane, Gladstone and Gold Coast, they’re all around in starting of recovery and it’ll be interesting to see where Sydney and Melbourne have been placed and just trying to find them but anecdotally I know that they’ve had some good comeback over the last three to four months and yes they’re listed in start of recovery. Sydney is there and Melbourne is there.
Now, the main reason I’d put that down to is to purely population growth and why they’re coming there, because of jobs.

About the Unit Market, what’s going on with Perth, we’re still in the declining market, 12 to 18 months behind the rest of the housing market and we certainly got further fall on the unit side. You never know, some of the changes that have made to the policies, could see this move quicker through. I’ll touch on that in a second when we get to it.

Factors affecting demand, this is probably my most interesting part to cover and I did it for the first time in August in my last market update that I put together and I’ve got a couple of deeper areas to go into here.
Availability of Finance
So the availability of finance, the RBA has not dropped rates again since August when I last came to you and they’ve been on hold since just waiting to see the impact I guess. The banks have relaxed their lending criteria as a result of that APRA policy changes and my finance broker friends are telling me that it is becoming easier, for the to make serviceability requirements and get a few more loans through for people which is great.
The biggest factor I guess which is affecting people’s ability to borrow is that anyone that’s bought in the last five or six years has had their deposit that they put in of 10% to 20% more or less wiped out because property prices have come down that 20% even if you can sell in this market, you don’t have your deposit to make use of to buy again even though prices out there are really great.
If you don’t have a deposit you are pretty much stuck where you are and you also can’t use that deposit or equity that you may have saved towards doing any investing.
So that’s the biggest factor stopping people and all the buyers that would otherwise be changing over, for those reasons they’re not in the market. So that is going to take a very long time for them to save enough to get back out there.
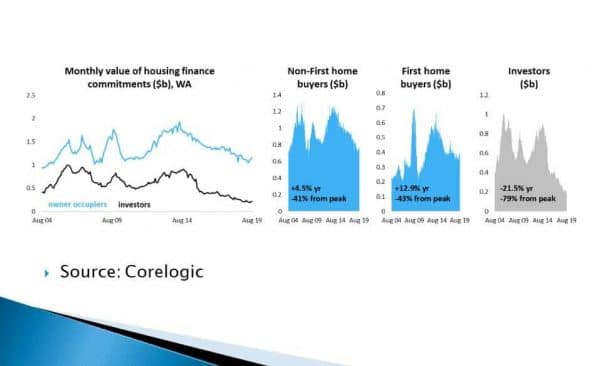
You can see from these graphs that the number of investors is 79% down on lending from it’s peak and we’re 21% down from a year ago in WA. The first time buyers thankfully you’re up to 12.9% in the lending to them and 43% down the peak and non-first time buyer then rise up to 4.5%, So some improvement there for for the first time buyers and non first time buyers taking up more of the percentage away from investors.

When we look around the States, you can see that the investor lending is the lowest in the WA. So that really goes to show how much we’re missing them in the market. I think there would have been more investors coming from the other States earlier if they didn’t have their declines in Sydney and Melbourne. We are seeing some early adopters from there making good buying decisions but I really think we’ve still got a lot more to see. We’ve only got 15.4% investor activity of financing being done. When you compare that to ACT on 26%, 31% NSW, 26% Victoria, it’s a big gap in the market.
Employment
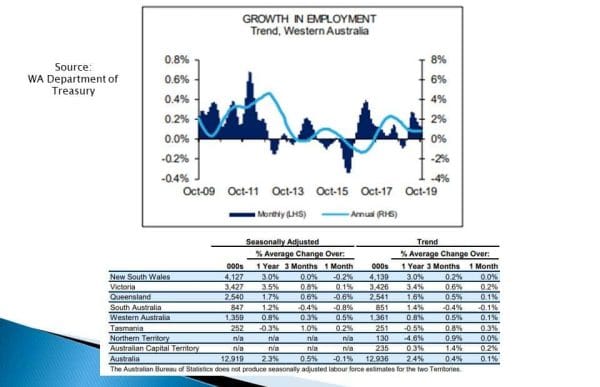
On the Employment side, you can see that we’ve had over the last year 0.8% increase in employment. We haven’t got back to the above 2% that we were at in 2018. So need to see this uptick and you can see why New South Wales and Victoria are so popular with Migrants, 3% change increase in employment for NSW and 3.4% in Victoria compared to about 0.8% in WA, so they’re 3 to 4 times more new jobs available there which is what brings the people into there.
Population Growth

So the population growth is what follows the employment and you can see that we’ve had 1% population growth (Year to March 2019) which has slightly been trending upwards over the last two years but still very slow growth. You can see that in NSW has had 1.4% population growth and Victoria tend to 2.1%, so these actually show that more jobs created in those areas than there is population growth, that leads to wage pressure and also price increases when you’ve got that population growth among people and more money to spend.
So you can see our net migration is still negative of people going to other States trending back towards the neutral you see. We’ve had an increase in overseas migration over the last couple of quarters which is good to see that we’re starting to see some of that back. We’ve really gotta see this population growth and employment side change otherwise, we’re not going to see the demand side return from buyers.
Policy Changes
75% Transfer Duty Rebate for Off the Plan Purchases
There’s a big impact on the demand side of the equation and one of them, I’m really not in favor of is the 75% rebate on the off the plan purchases, so they thinking of the State Government and a number of bodies was to stimulate the construction industry, get some jobs back.
You can see from the construction stats that I listed earlier that industry is definitely hurting but the downside of such a policy is that it affects the established market in those areas. Many people are just going to want to buy new instead of established, so that makes the re-selling of your establishments apartment even harder to do now and that’s what we’ve seen in the outer areas where someone would rather buy a house and land package then buy an established property there because of the $10,000 grant that applies as well. So I’m really not in favor of that as helping out the balance of buyers in our market.
Perth Classified as Regional City
This next one we’ve been finally reclassified as a Regional City which will have a big impact on our population growth and make us more attractive to overseas migrants making it easier for them to get their visas and come into our state. And this is one of the changes that led to Hobart gaining so much population over the last five years and their economy surging, so that’s a very big positive to be reclassified as that.
Other Policy Changes Still Needed
Some of the things that REIWA was calling for that I’m very much in support of is a return of the $7000 first home owners grant for established property that we still really need to happen that would even out and make established properties a bit more attractive to buy and lower the barrier to entry for the first-time buyers.
An increasing of the transfer free threshold to $550,000 for first home buyers would just open up the market a bit more for them to pay just slightly higher up price property if they can afford it and
The final one I’m calling for along with REIWA is a revoking of the Foreign Owner Duty Surcharge, we need to lower the barriers for the migrants to come in and I know that population growth can be a touchy subject with not everyone being in favor of overseas migration but I only see it as a positive since we’ve got an aging population we need skilled migrants that’s really about who we’re bringing in and looking for the right fit and the right skills to come into Perth and we can all benefit from that if it’s done right.
Top Predicted Suburbs – 12 MONTHS
So I waited by my August update, I mentioned the North Coastal areas of Heathridge, Padbury, Harmersley and Craigie, they’re still looking good for me over the next 12 months as the best investor spots to focus on.
My Crystal Ball.. Unchanged
When we look at my crystal ball, it’s unchanged on what I said in August 2019. I believe we’ve got around six months before our bottom. I believe the North Coastal area will do best over this 12-month period along with the Western Suburbs. I believe that the rental market will likely come back before the Sale Market does because people usually rent before they buy and once they’re new to an area.

So that brings me to the end of my market update and I just want to say very Merry Christmas to you and your family. This is us at the shopping center the other week and trying to get a photo with our baby, now 15 months old now and she was utterly afraid of Santa and it was a real battle just to have a shocked look on her face as opposed to bawling tears. We got her comfortable again and reversed her into the chair without seeing Santa and then there were tears afterwards when she realized where she was.
So hopefully you have a very Merry Christmas with your family and I’m wishing you all the best and thank you for tuning into my market updates and for anyone that’s a client of ours, I know it’s been another difficult year for being a landlord but hopefully things will gradually start to improve next year for all of us and I wish you the very best.